Graphs

Children can enter their own data and see these represented in the different graph formats from bar and pie to scatter. Students can move between formats at the click of a button while using relevant data they have input themselves. See how the graphs change in response to a change in data input. This is only a sample of the content available.


Click to enlarge
Teaching Mathematics in 3D
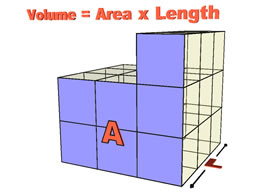 Mathematics education provides fundamental tools for understanding science, engineering, technology and economics. Learning mathematics also helps pupils develop essential skills in problem solving, risk assessment and critical thinking. Our 3D models provide a unique alternative delivery method for math content aimed at involving all students through critical thinking and collaboration. Read More